Week 32 : 3/27/2023 - 4/3/2023
- Daniel Eisenbraun

- Apr 3, 2023
- 3 min read
This week I focused primarily on data comparison from our previous tests on 3/26/2023 to 3/28/2023 to verify our high level and medium level requirements as well as performing the driving test required for our requirements.
4.1.4 Crossflow Ventilation Comparison Test Data Analysis
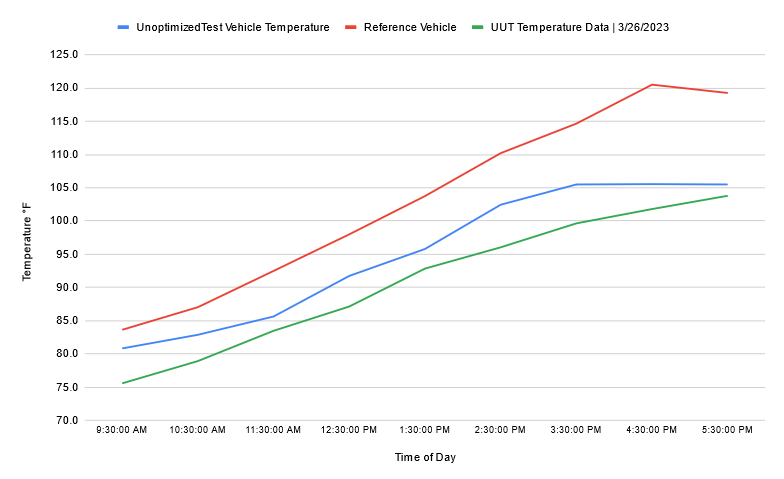
State in our high level engineering requirement for cooling provided, our device operating in an optimized manner must provide ≥ 30% more cooling than the device running in a non-optimized mode. Charting the results in Excel and checking the Average values for temperature gathered between 3/26/2023 and 3/27/2023, we can see that the average temperature inside of the un-cooled reference vehicle averages to 103.3°F throughout the day. Using optimized crossflow ventilation, this temperature drops to 91°F and using non-optimized crossflow only drops to 95.1°F.


This difference between the optimized temperature and reference vehicle then is 12.3°F on average while the non-optimized difference is 8.2°F on average. The difference then is 40% meeting our requirement. A 4.1°F difference between the two may seem trivial, but this results in an initial heat load reduction of 240W. Using the equation for Specific Heat, we can calculate the power necessary for the AC system to displace the heat in the air of our vehicle.
Q = m*c*dT, where m is the mass flow rate of the AC system, C is the specific heat of air, and dT is the change in temperature needed (from our starting temp to 72°F)
(Unoptimized) Q = (0.07 kg/s) (1.005kJ/kgK) (35.055 - 22.222) = 903W
(Optimized) Q = (0.07 kg/s) (1.005kJ/kgK) (32.777 - 22.222) = 743W
4.5.2 Automatic Run/Shutoff Test
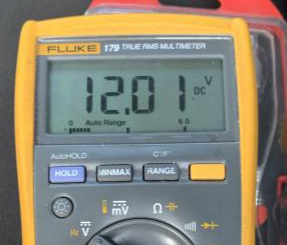
Following the testing done on 3/27/2023, the device code was modified briefly to have the fans run at maximum power to run down the battery as quickly as possible to confirm functionality as well as a fix for the battery mode code relating to shutdown by Ian. The device ran from 6:12PM on 3/27/2023 to 8:49AM on 3/28/2023 before shutting down at 12.0V on the PWM read as 12.01V on the DMM.


Plugging in the solar panel, the device quickly began to charge with the PWM hopping to 12.1V and the fans reactivating then quickly the PWM hopped to 12.2V.

4.4 First Structural Integrity Test
On 4/31/2023, I drove from Apopka to Tallahassee FL with the vent visors installed to my vehicle. The trip took me on I-75N to I-10W and was well over 200 miles. During the drive, no major issues were noted during the driving nor during stops for gas. Top speed reached was 80mph with an average sustained speed of 70mph per the speed limit on the highway.
At the final location, no damages to the vent visors were noted. Note : appearance of vent visors is spotted due to application of a layer of adhesive spray weeks ago to repair cracks in segments previously noted. No new cracks formed nor did any grow.


Report Work and Calculations
Continued to work on the report, updating chapter 1 with proper equations for specific heat and verified the number of fans required for proper operation by adding in calculations for the required amount of air flow for cooling under Summer conditions in chapter 3 to show that the number of fans used in the project would be sufficient for our purposes. Continued to work on Chapter 3 and plan to work on Chapter 4 once testing has been concluded later this week. No significant amount of rain has fallen throughout the day where my car is parked in Orlando, Apopka, or Tallahassee.


Comments